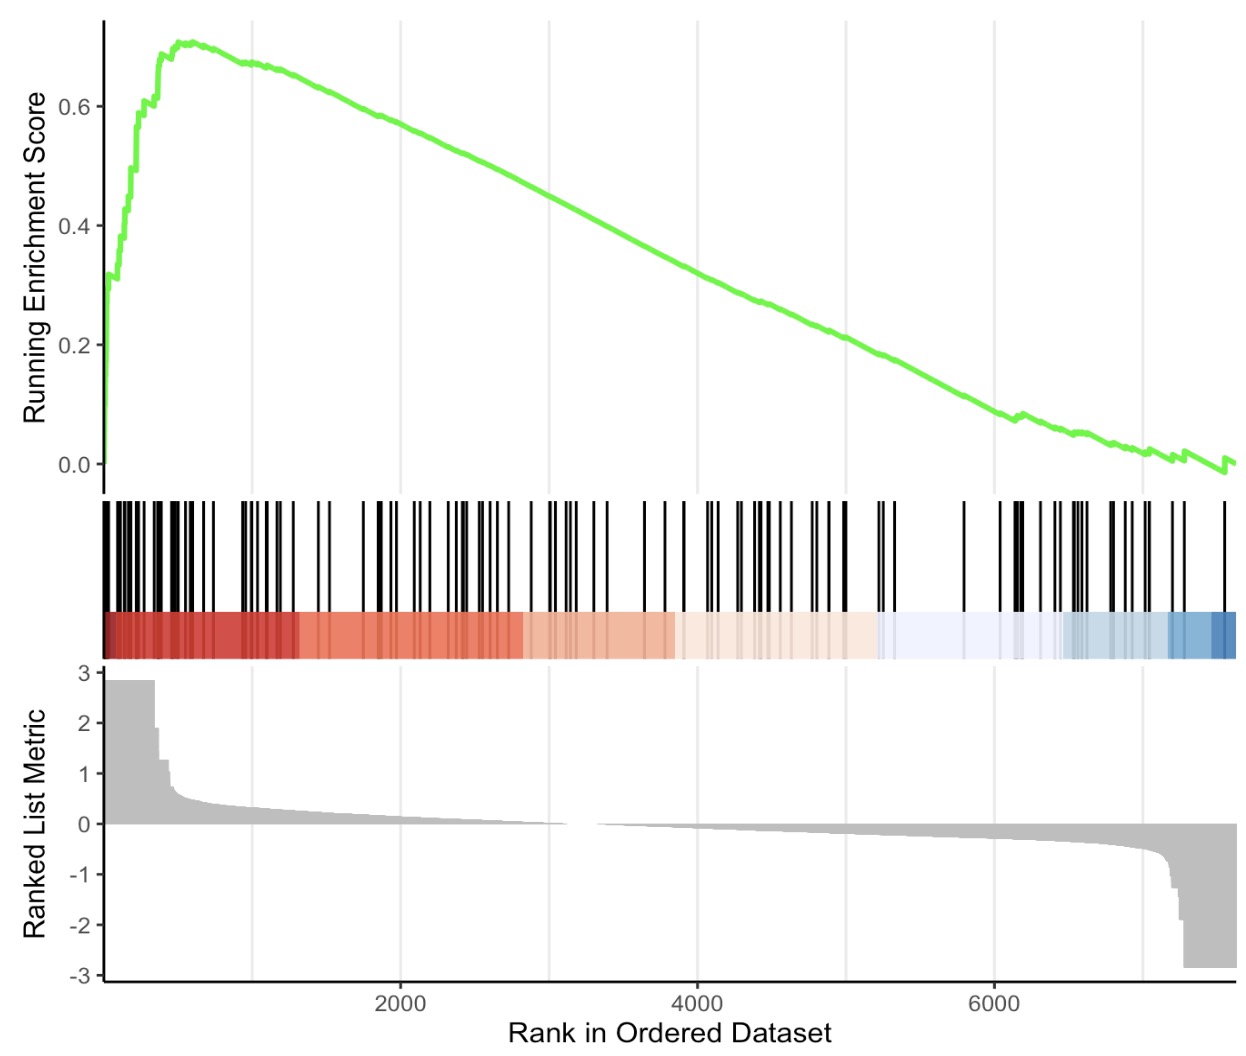
8.6 EMP_GSEA_plot
The module EMP_GSEA_plot is designed for the GSEA result.
🏷️Example:
MAE |>
 EMP_GSEA_analysis(experiment = 'geno_ko',method='signal2Noise',
                   estimate_group = 'Group',
                   pvalueCutoff = 0.05,keyType = 'ko') |>
 EMP_GSEA_plot(geneSetID='map00680')